Here is a question to ask any SEO vendor you’re paying monthly: when you change a page, do you ever check whether the change worked, and if it made things worse, would I find out from you?
Most of the industry fails both halves. Work ships, an invoice follows, and the report shows whichever numbers happened to go up that month. The refresh that quietly cost a page a third of its clicks appears nowhere, because nobody compared the page to itself, and nobody was ever going to volunteer the comparison that makes the vendor look bad.
We built the opposite into MergePress as a hard rule: every content refresh and SEO fix we ship gets re-measured about five weeks later, against your own Search Console data, and the verdict, win, flat, or loss, goes in your report either way. This post explains exactly how that measurement works, including the two refusals that make it honest: we won’t measure early, and we won’t measure without a real baseline.
The five-week answer to “did it work?”
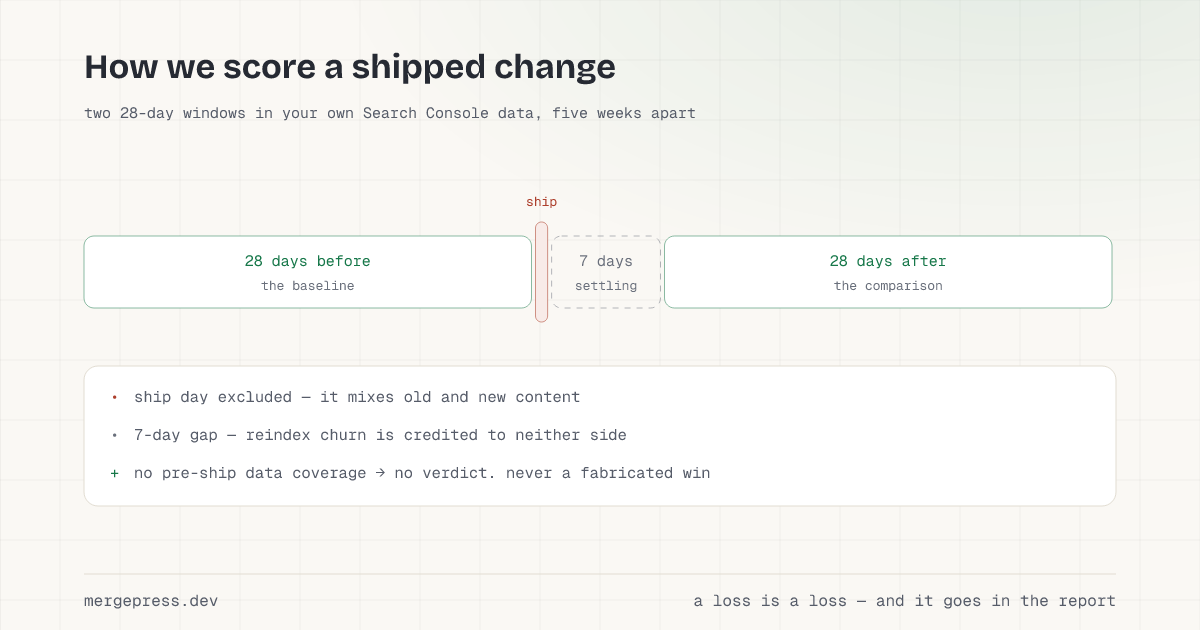
When a refresh PR merges and the page goes live, a clock starts. The measurement compares two windows of Search Console data for the affected pages:
- The baseline: 28 days before ship, ending the day before the merge. Four full weeks, so the window contains every day of the week the same number of times and a weekend dip can’t masquerade as a decline.
- The comparison: 28 days after ship, but not starting immediately. It starts seven days after the merge and runs four weeks from there.
Ship day itself belongs to neither window. It’s the one day that mixes old and new content: Google served the old page in the morning and the new one at night, and no honest accounting can assign that day to either side.
Add it up and the comparison window closes 35 days after the merge, five weeks. Then we wait a few more days, because Search Console data isn’t final when it first appears; recent days arrive provisional and settle later. Only when the final data covers the entire comparison window does the measurement run. So the practical answer to “did the refresh from early March work?” arrives in mid-April. That’s slower than anyone’s dashboard and it is the earliest the question can be answered truthfully.
Why the seven-day gap
The week after a content change is a transition, not a result. Google has to recrawl the page, reprocess it, and re-rank it, and while that’s in flight the metrics wobble in ways that belong to neither version of the page. Rankings dip and recover during reindexing; sometimes they spike on pure novelty and fall back. If the comparison window started the morning after the merge, that churn would land in the “after” column and get credited, or blamed, on the change itself.
So the first seven days are dropped on the floor, deliberately. Not counted for the new version, not counted against it. What’s measured is the page’s settled performance, which is the only thing you’re actually paying to improve.
The same logic drives the refusal to measure early. Suppose we ran the numbers at day 20 instead of day 35: the comparison window would be short a week or more of data, the “after” totals would be mechanically lower, and a perfectly good change would read as a decline. An early measurement doesn’t approximate the honest one, it’s biased in a known direction. The system treats “not enough final data yet” as a reason to wait another night, every night, until the window is truly covered.
No baseline, no verdict
The second refusal matters more, because getting it wrong produces the pleasant kind of lie, the kind nobody complains about.
Our measurements run against a local warehouse of your Search Console daily data, built up night by night after you connect the property. Now imagine a page shipped shortly after onboarding, before the backfill of historical data completed. The warehouse might hold every day of the comparison window and almost none of the baseline. Run the comparison anyway and the baseline scores near zero, not because the page had no traffic before, but because the data isn’t there. Against a zero baseline, any traffic at all looks like growth. Every early customer’s first report would be a wall of fabricated wins.
This is not a hypothetical failure mode; it’s the default behavior of any pre/post comparison bolted onto an incomplete dataset, and it flatters the vendor, which is exactly why you should ask about it. Our rule: unless final data covers the entire 28-day baseline window, there is no measurement. The system backfills history, waits, and retries the next night. A verdict delayed by a data gap is an inconvenience. A win manufactured from a data gap is the precise thing you hired a measurement to protect you from.
What counts as a win (and what doesn’t)
Once both windows are covered, the arithmetic is deliberately plain. For the affected pages we total clicks and impressions in each window, and compute an impression-weighted average position, weighted so that the days the page was actually being seen count for more than the days it wasn’t.
The verdict comes from clicks, with a coarse threshold: more than 10% up is a win, more than 10% down is a loss, and anything inside that band is flat. Two honest edge cases get their own handling:
- A page with no impressions in either window is scored no-data, never a win. Zero-to-zero is not growth, whatever a percentage formula might claim.
- A page with impressions but no clicks in the baseline can’t produce a meaningful percentage (any click would be infinite growth), so it only counts as a win if the new version actually earned clicks.
Why such a blunt threshold? Because for a small business site, weekly click counts are small and noisy, and a measurement that pretended to distinguish +4% from −3% would be reporting noise with a straight face. The coarse bands are the honest resolution of the instrument. “Flat” is a common verdict, and reporting it as flat, rather than dressing a +2% wiggle up as momentum, is part of the deal.
Why the losses go in the report
The uncomfortable part isn’t measuring; it’s publishing the result when it’s bad. Here’s why we do it, beyond the obvious point that you’re paying for the truth.
A vendor who only reports wins isn’t measuring; they’re selecting. Given enough metrics, date ranges, and pages, something always went up. The report that shows you a hand-picked improvement is describing the report-writer’s search process, not your website. The only way to make a measurement credible is to commit to the method before seeing the answer, then print whatever comes out. Our windows, thresholds, and refusals are fixed in code and described on this page; the verdict is whatever the data says.
A recorded loss is the start of the fix. Each cycle is measured once and the result is written down permanently, the same append-only record-keeping we use for content approvals. When a refresh loses, that’s not a line we bury; it’s a signal that the change should be revised or reverted, and because every change we ship is a git commit in your repository, reverting is one click, back to the exact version that was working. A loss you know about costs you five weeks. A loss nobody measured compounds for as long as nobody looks.
Incentives, again. We’ve written before about why we price per approved post instead of per generated article: the unit you’re billed for should be the unit you actually wanted. Measurement is the same argument one level up. If our refreshes stopped working, honest re-measurement means our own reports would say so, in plain text, month after month. We’d rather run a service where that pressure exists than one where the reporting layer absorbs every mistake.
What this measurement is not
Fixed method, printed limits. So here are the limits.
A pre/post comparison is not a controlled experiment. The 28-day windows sit five weeks apart on the calendar, and the world doesn’t hold still: seasonality, a news event, a Google algorithm update, or a competitor’s launch can move the numbers, and the method will attribute that movement to our change. A “loss” verdict sometimes means the market moved, not the refresh failed, and a win can be borrowed tailwind. The coarse thresholds absorb some of this; they can’t absorb a core update landing mid-window. When we know about a confound that big, the report says so next to the verdict.
It’s also scoped to the pages the change touched. A refresh that improves one page by cannibalizing a sibling page’s query would score as a win on the measured page; sitewide effects need sitewide eyes, which is what the rest of the monthly report is for.
And the verdict is about search performance, not business value. Clicks are the best proxy Search Console can give us; they are not leads. That’s why the report leads with calls and form fills, and treats this measurement as evidence, not the headline.
Those caveats are why we present each result plainly (windows, totals, deltas, verdict) instead of a single triumphant number. You should be able to see exactly what was compared and decide how much weight it deserves.
The habit, not the feature
The mechanics fit in a sentence: 28 days before against 28 days after, a 7-day settling gap, no verdict without full baseline coverage, and the loss column printed in the same font as the wins. Any competent team could build it in a week. What’s rare is shipping it as the default and letting it grade your own work in front of the customer, every month, the same reason our approval loop exists: nothing publishes without your sign-off, and nothing we publish escapes being checked against reality afterward.
If a vendor is re-measuring their own shipped work, they’ll happily show you the method; it’s a selling point, as this post demonstrates. If they aren’t, you’ve learned the report you’re getting is a highlight reel. Either answer is worth the sixty seconds it takes to ask.